Exploring Plant Phenology Using Herbarium Specimens
|
An undergraduate research course developed by the California Phenology Network
We're published! You can also find our materials on QUBES: https://qubeshub.org/publications/1956/1
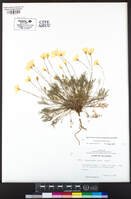
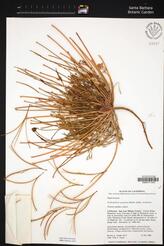
In this course, students will design and conduct original research to examine the effect of climate on plant phenological events (e.g., flowering) using herbarium specimen data. Students will augment existing specimen records with phenological and georeference data in the CCH2 data portal. They will then visualize, clean, and analyze herbarium specimen data and climate data using Excel and R code (through RStudio). Each student will present their research as a scientific report, poster, and/or a lightning talk. During weekly class meetings, important topics and guidance regarding the research process will be discussed.
|
|
|
Course overview
|
|
|
This course was designed for a relatively small class of advanced undergraduate students for a 10-week quarter. No previous experience with R or herbarium specimens is necessary, but students should have basic knowledge about the scientific method and be comfortable reading scientific literature. The weekly schedule of topics is shown below.
|
|
Course Materials
|
This section will include the Instructor's guide, which will provide a more detailed schedule and overview of each class session, and each of the assignments, codes, and other materials that can be individually downloaded. This page will be updated as materials are finalized.
|
Protocols
Protocol 1: Using the CCH2 Data Portal
This protocol describes how to use the data portal where students will download specimen data. Protocol 2: Getting started in RStudio This protocol instructs students to complete R tutorials, then discusses how to set up RStudio and an appropriate file structure on their computer to prepare them for the rest of the course. Protocol 3: Phenological Scoring in CCH2 This protocol describes how to score the phenological status of herbarium specimens (e.g., flower present, flower absent) using tools in CCH2. Protocol 4: How to Download Phenological Data from CCH2 This document shows how to download the phenological (e.g., flowering/fruiting) data from CCH2. It can be used regardless of whether the students phenologically scored the data themselves, or if they just want to harvest existing phenological data. Discussion and Conclusions Checklist Students can use this document to guide writing the discussion and conclusions sections of their poster or paper. |
R Scripts and DatasetsClass 3 Demonstration Code and Example Dataset
Assignment 4 Code and Example Dataset (also provided in Assignment 4 above) Final Data Cleaning and Analyses Code |
Class SlidesClass 1: Introduction to Course
The first class is instrumental in helping scaffold students' understanding of the purpose and background of the course. Class discussion includes the format and purpose of the course, background information about phenology using herbarium specimens, and how to create a testable scientific question. The source of climate data, PRISM, will also be discussed, along with the climate variables the students will use to conduct their analyses. Class 2: Refining your Research Question The second class is dedicated largely to discussing students' preliminary research questions and how they can be improved. Students should submit these questions prior to class, and they will be discussed during class with an emphasis on (1) whether the question is testable given our data, (2) whether the independent and dependent variables are well-defined (i.e., name a specific place, time, and type of variable), and (3) whether the question asked is scientifically interesting. The class will also discuss how students will phenologically score their specimens in CCH2. Class 3: Linear Regression in R Class 4: Intro to Georeferencing Class 5: Creating a Research Poster / Paper Class 6: Data Cleaning Class 7: Results Class 8: Discussion and Conclusions Class 9: Giving and Receiving Feedback |


